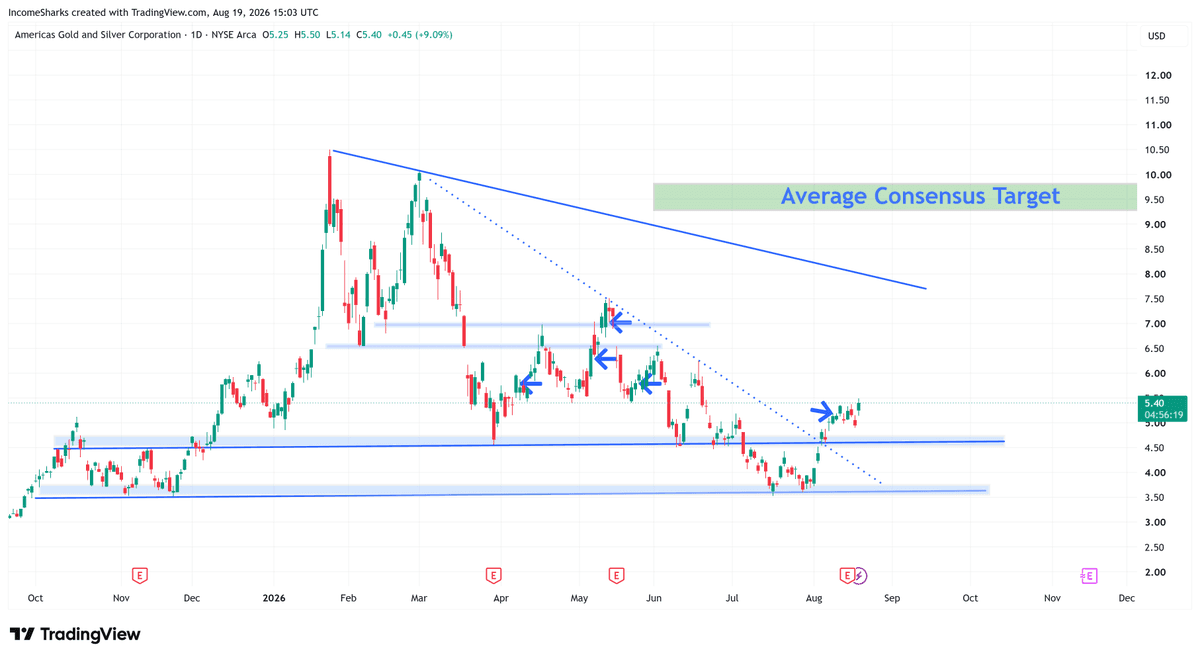
Silver Chart Structure: Support and Resistance Framework
Silver is trading near critical technical levels as the commodity transitions through mid-year consolidation. The metal has historically traded between defined support and resistance zones tied to both macro sentiment and industrial demand cycles. Current price action reflects a balance between safe-haven accumulation and industrial consumption patterns, with technical traders watching specific Fibonacci retracement levels and moving average intersections.
The structure of recent price movement shows Silver respecting key support zones that align with quarterly production cycles and ETF inventory flows. Major moves in the commodity typically coincide with Federal Reserve policy pivots and real interest rate shifts, creating defined technical windows where algorithmic and discretionary traders position accordingly.
Mining Fundamentals Underpin Technicals
Industrial metal prices respond to both chart patterns and operational reality on the ground. Junior mining operators in the Silver space are reporting improved quarterly results, with some entities posting profitable periods in the first half of the year despite operational setbacks. One analyst cited on social media claimed certain junior miners could reach valuations between $8 to $10 by the fourth quarter, conditional on stable or rising Silver prices through the second and third quarters.
Operational momentum matters to technical analysis because sustained mining expansion signals supply constraints remain manageable. When producers report stronger output or operational efficiency, it reduces the probability of supply shocks that could break chart patterns. Conversely, disruptions - such as the fire-related production loss mentioned by industry observers in Q2 - create temporary technical imbalances that can accelerate price moves if they coincide with demand cycles.
Revenue diversification within mining operations, including byproducts like antimony, also affects sector strength and can reduce volatility in base Silver prices if hedging strategies improve.
Technical Signals: RSI and Volume Dynamics
Read the full analysis.
Enter your email to unlock this article — and get every new Brief delivered the moment it publishes. Free. No spam.
No spam. Unsubscribe anytime. The desk's read, free.
The terminal behind this read. Free.
Open The Desk →Live charts, positioning and macro — arranged your way. No account needed.
Live data behind this story: breakout flags with a published track record →