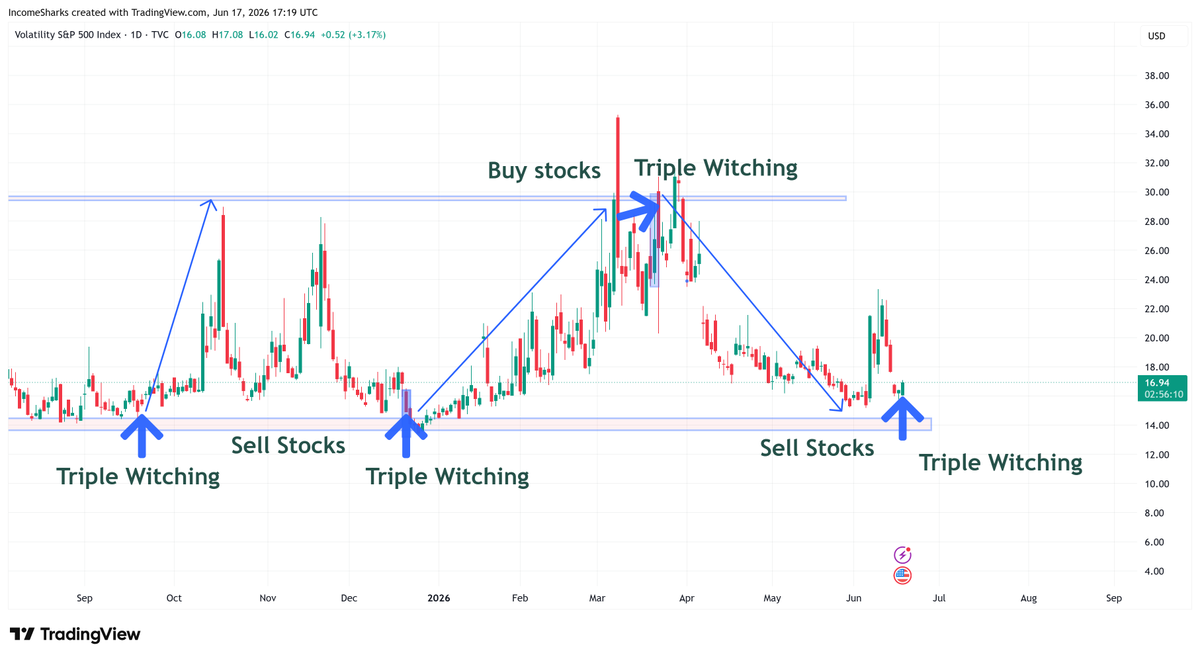
The Triple Witching Phenomenon in VIX
Triple Witching Days - when equity index futures, equity index options, and individual stock options expire simultaneously - have historically coincided with elevated trading volume and price dislocation across derivative markets. Observers of the VIX have noted that over the past four Triple Witching events, the volatility index has either peaked or bottomed in proximity to the expiration window, suggesting institutional position unwinding or hedging flows may be creating predictable technical structures. This pattern, if sustained, indicates that options expiration mechanics are imprinting themselves onto the broader volatility landscape in ways technical traders can map.
Current Technical Setup: Ambiguity at the Decision Point
With another Triple Witching Day approaching, the VIX stands at a critical juncture. The index has demonstrated that it either completes a cycle or reverses at these expiration windows, but the directionality remains uncertain. The source analysis suggests two competing scenarios: either volatility was front-run ahead of the event (meaning the recent VIX movement already priced in the institutional flow), or the next week will see a sharp directional move as positions unwind and new risk catalysts emerge. This binary outcome underscores the fundamental ambiguity in mean-reversion trades - the reversal can happen early or late, and timing the exact inflection point remains a persistent challenge for options-based traders.
The repeat bottoms and tops across the previous four Triple Witching dates establish a technical pattern worth monitoring, but pattern persistence is not guaranteed. Market structure can shift when participant behavior changes, macro conditions evolve, or new liquidity regimes take hold. The VIX's predictability during these expirations may itself become a victim of its own visibility if sophisticated traders begin to position ahead of it systematically.
Volatility Regime Implications for the New York Session
Read the full analysis.
Enter your email to unlock this article — and get every new Brief delivered the moment it publishes. Free. No spam.
No spam. Unsubscribe anytime. The desk's read, free.
HH, HL, LH, LL — and what actually breaks a structure vs. what's a fakeout.
Want Daily Intelligence Like This?
Inside Liquid State, members get live liquidity maps, daily trade setups, weekly recaps, and a private community of serious traders.
Go LiquidOr start free — get the live feed on Telegram →
Live data behind stories like this: breakout flags with a published track record →