$DOT closes the gap to structural resistance
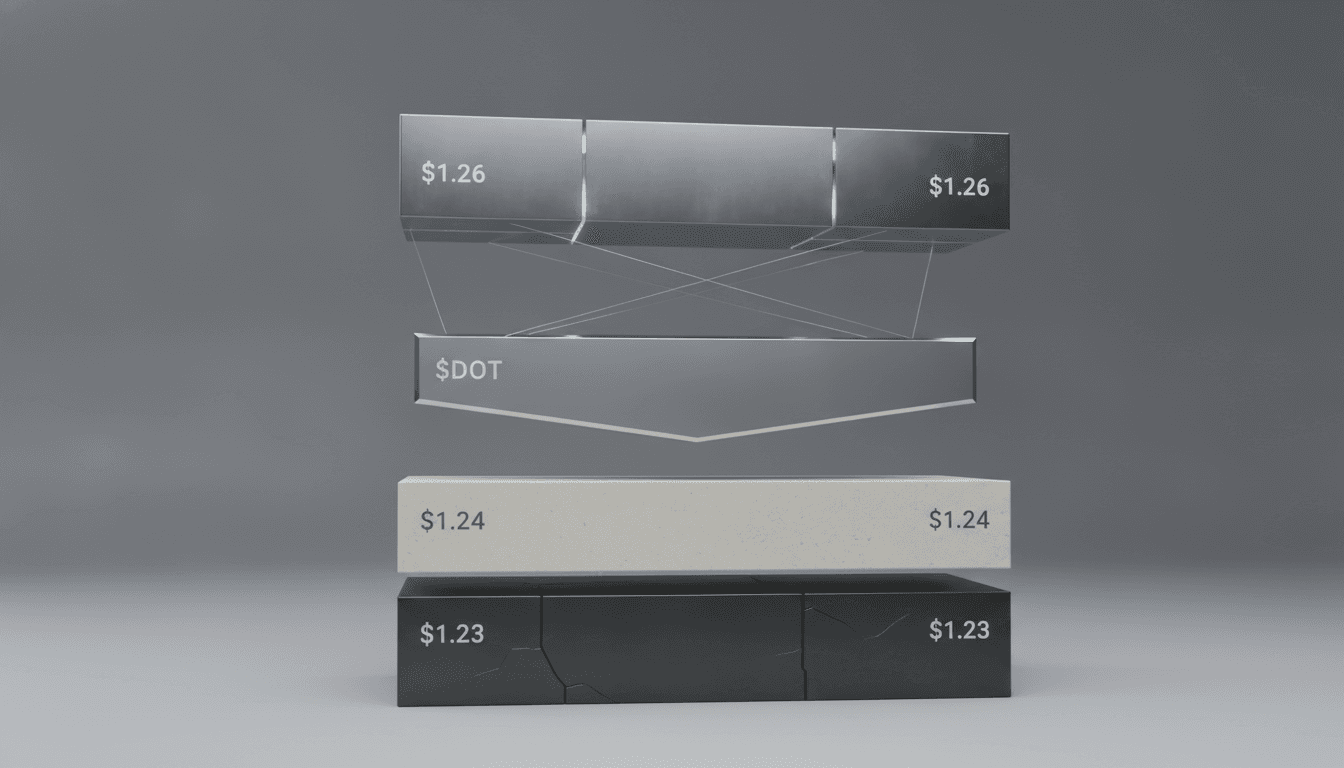
$DOT is trading at $1.24 after reclaiming the $1.23 level on the 4H timeframe. This price action reflects a move off support, but the 24h loss of 1.24% shows persistent selling pressure at higher levels. The zone between $1.23 and $1.26 now represents the critical decision point for the session ahead. A close above $1.26 would signal continuation; failure to hold above $1.24 resets the structure lower.
Fibonacci and resistance cluster at $1.26
The $1.26 level is not arbitrary. This price aligns with a confluence of resistance: the recent swing high, a 0.618 Fibonacci retracement from the most recent decline, and a key weekly resistance cluster. Breaking through this zone requires sustained volume and conviction. On-chain metrics do not show aggressive accumulation at current levels, suggesting institutional interest remains guarded. The 24h volume of $114M is below average for $DOT moves of this magnitude.
RSI and momentum structure
On the 4H chart, RSI behavior is the telling signal. If RSI is holding above 50, a push to $1.26 is plausible. If it has rolled below 50 or failed to hold a higher level, the $1.24 print may be a trap, and retest of $1.21 - $1.20 becomes the next target. MACD divergence (lower highs in price with higher lows in MACD) would confirm weakness. Watch the current candle close: if it closes above $1.25 with volume, the structure is intact. A close below $1.23 invalidates the bounce thesis entirely.
Session context and the broader market
$BTC is holding flat at $82,979 with only 0.19% 24h movement, while $ETH is down 0.07% at $2,500.11. This lack of directional conviction in the majors is a headwind for altcoin breakouts. $DOT's positive sentiment (85% on LunarCrush) is not translating to price strength, a potential divergence signal. The London session often sees profit-taking on overnight Asia moves; traders should watch for the $1.24 - $1.26 zone to become a distribution point if volatility picks up. A move above $1.26 on size would be the breakout confirmation; anything less is noise.
Key Takeaways
- $DOT at $1.24 sits between $1.23 support and $1.26 resistance; the next 48 hours will define whether this is a breakout or a failed bounce.
- The $1.26 level is a Fibonacci confluence zone and weekly resistance cluster; volume and RSI above 50 are required to break through.
- Social sentiment is positive (85%), but on-chain volume ($114M) remains low, suggesting institutional buyers are waiting for structural confirmation.
- If $1.24 fails to hold, retest of $1.21 - $1.20 is the logical next target; watch the MACD for momentum divergence.
- The flat performance of $BTC and $ETH provides limited tailwind; $DOT must prove itself on relative strength.