Resistance Breakout and Structure
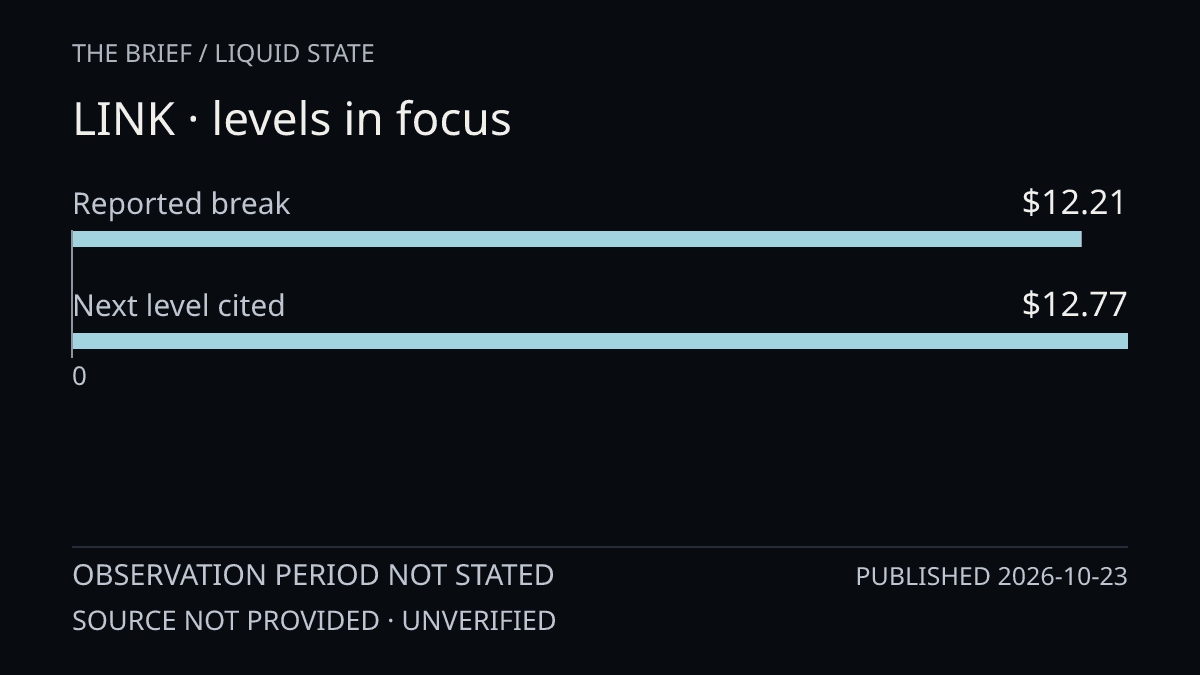
$LINK has reclaimed the $12.21 resistance level on the 4-hour timeframe, marking a shift from rejection to acceptance at this price. The move represents a clean break above a technical ceiling that had constrained price in recent sessions. Volume across the $243M 24-hour print indicates participation, though not exceptional depth for a breakout confirmation.
The structural move now places $12.77 as the next defined resistance zone - a Fibonacci or swing high that represents meaningful supply absorption. Price is currently trading near $12.22, sitting just above the reclaimed level, which is a typical behavior post-breakout as buyers test whether the break holds conviction.
Chart Structure and Key Levels
On the 4-hour chart, the $12.21 level had functioned as overhead resistance, repeatedly rejecting price in earlier sessions. The reclamation above this level is textbook breakout structure: buyers absorbed selling pressure and closed price above the ceiling, not below it. This shift from rejection to acceptance is the core signal, not the magnitude of the move itself.
The $12.77 target represents the next structural resistance. Between $12.22 and $12.77 lies roughly 5.5% of upside. The zone between here and the next resistance is the consolidation or continuation zone - where traders typically add or reduce exposure depending on their time horizon and entry logic.
Support is now likely to sit near the reclaimed $12.21 level itself, or potentially lower at prior swing lows. A breakdown below $12.21 would invalidate the breakout structure and signal rejection, returning price to a range or downtrend bias.
Session Context and Volume Consideration
This breakout is unfolding within the current trading session's flow. $LINK's 0.41% 24-hour gain and positive sentiment reading at 82% suggest traders are watching the move, though social dominance remains low at 0.84% - meaning conversation volume is minimal relative to larger assets. That can work both ways: fewer shorts to squeeze, but also less narrative momentum to sustain a breakout.
The $243M 24-hour volume is respectable for $LINK but not exceptional; a sustainable breakout typically confirms with volume that rises as price extends, not declines. This is the key metric to watch on the next few 4H candles.
Key Takeaways
- $LINK reclaimed $12.21 resistance on the 4H chart, shifting from rejection to acceptance at this structural ceiling
- Next defined resistance sits at $12.77, approximately 5.5% above current price
- Support is now anchored near the reclaimed $12.21 level; a break below invalidates breakout structure
- Volume and follow-through candles are critical to confirm whether this is a sustained breakout or a failed probe above resistance
- Positive sentiment at 82% contrasts with low social dominance at 0.84%, indicating limited narrative fuel for extended continuation