Support Breakdown Structure
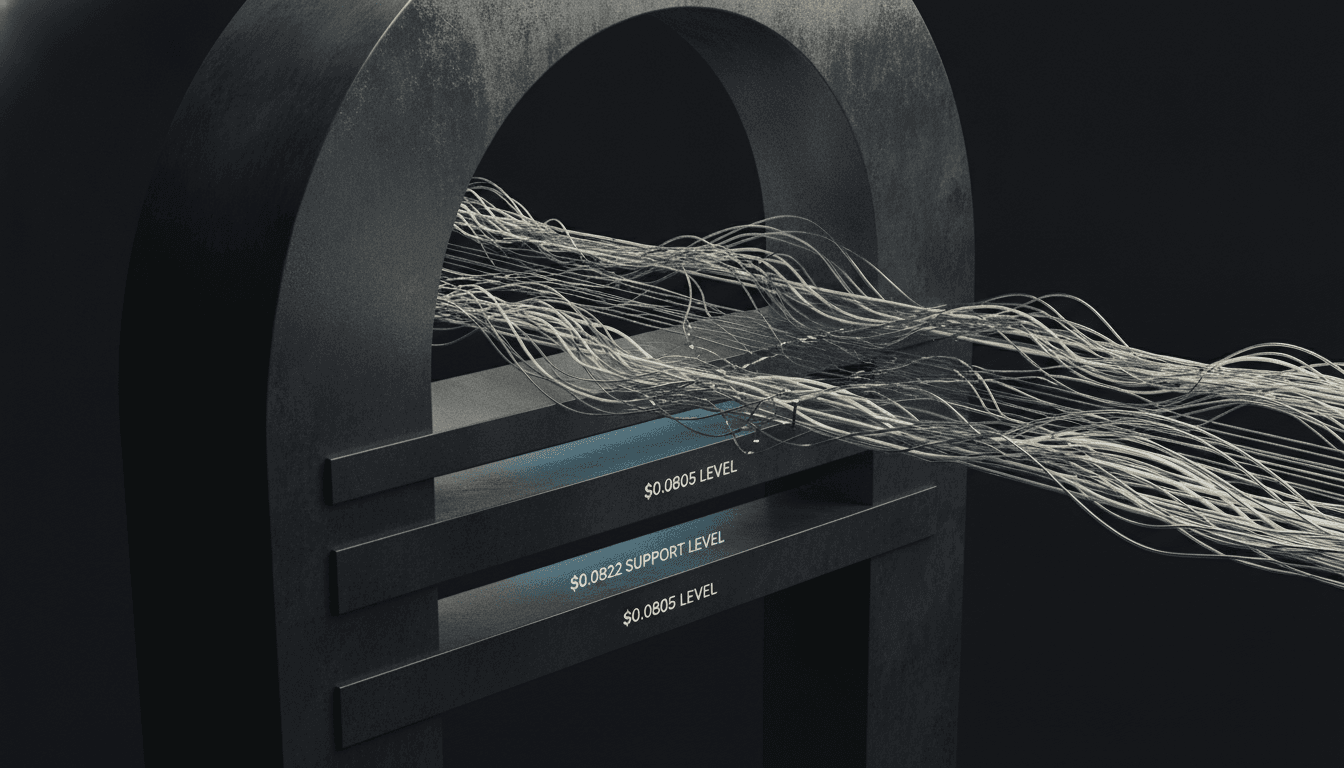
$SUI traded through its 4H support level at $0.9560, signaling a shift in near-term momentum. The current price of $0.95 represents a 4.36% 24h decline against a $410M volume backdrop - modest liquidity relative to $BTC and $ETH, amplifying the impact of directional moves. This breakdown wasn't a wick reject; price printed below and held, confirming conviction in the move lower.
The $0.9560 level functioned as a structural floor built from prior swing lows and bounces. When support of this age and consistency breaks cleanly, it typically transitions into resistance on any relief bounce. Traders actively shorting this move would use a reclaim of $0.9560 as a logical exit or tightening point for stops, not a reversal signal.
Fibonacci and Next Structural Targets
The next material support sits at $0.9348 - a 0.73% lower from current levels. This confluence point likely represents a prior swing low or a 50% Fibonacci retracement from a recent intermediate high. Testing $0.9348 would place price in the lower quartile of the recent range, where capitulation trades often cluster.
Below $0.9348, structural support becomes sparse. The absence of clear buy-side liquidity below current price is a hallmark of bearish market structure - sellers have control and buyers are thin. $SUI's $0.46% social dominance (per LunarCrush) sits well below $BTC (24.92%) and $ETH (10.48%), suggesting retail attention is muted despite an 86% positive sentiment reading. This disconnect - high sentiment but low dominance - can mask weak underlying participation.
Session Context and Momentum Signals
The breakdown occurred during an Asia or early London session window, where volume tends to thin and stops accumulate. Thinner volume amplifies moves in either direction, and $SUI's sub-$500M daily volume means larger institutional orders can move price decisively. RSI and MACD readings (not provided in real-time here) would need to confirm momentum deterioration below 50-line and centerline respectively to validate trend weakness rather than a temporary pullback.
Price action below $0.9560 with rising volatility but declining volume can also signal capitulation - the final shakeout before stabilization. Traders should monitor whether $0.9348 holds as a floor or breaks further; a hold with a rejection wick would suggest a potential reversal entry for long-biased traders, but current structure remains decidedly bearish.
Key Takeaways
- $SUI broke 4H support at $0.9560, currently trading at $0.95, down 4.36% in 24h with $410M volume
- Next structural support at $0.9348 - likely a 50% Fibonacci retracement from a recent swing high
- $SUI's 86% positive sentiment coexists with minimal 0.46% social dominance, suggesting weak underlying retail participation in the move
- Watch for RSI/MACD confirmation of bearish momentum to validate trend extension versus capitulation bounce
- Support breakdown in low-volume conditions amplifies move size; larger institutions can move price decisively in $SUI's $410M daily volume