Structure Under Pressure
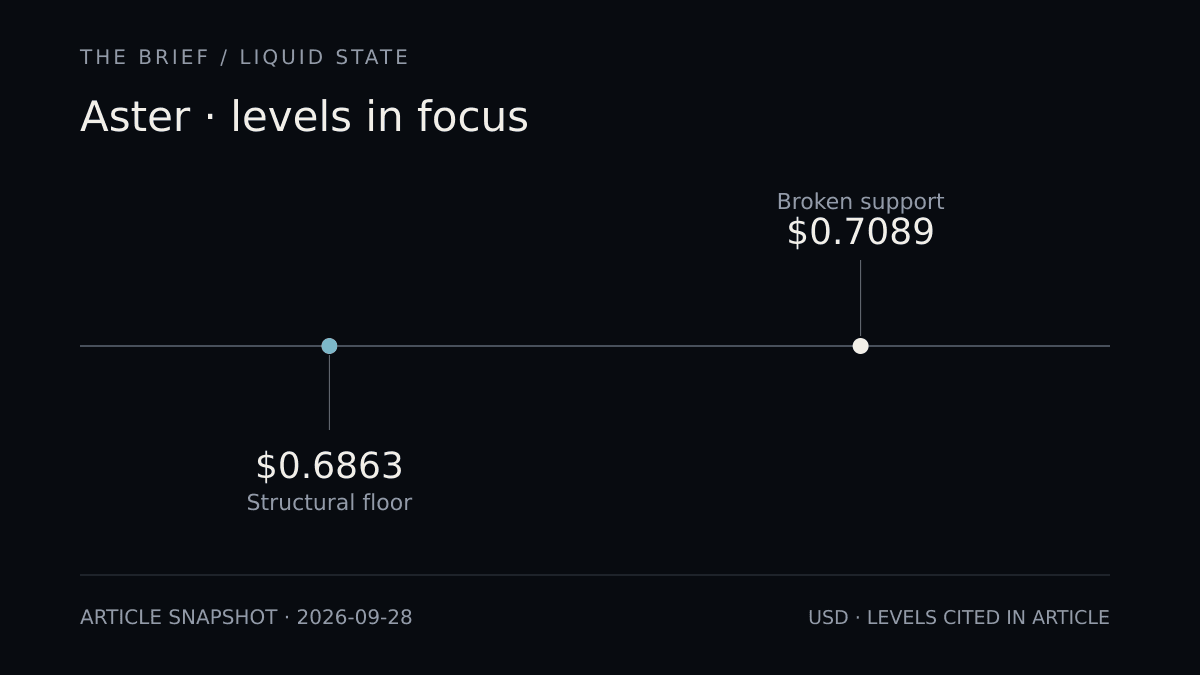
$ASTER has broken through its most recent support level at $0.7046 on the 4H chart, a move that signals a shift in short-term momentum. The asset is currently trading near $0.6873, representing a roughly 2.5% decline from the broken support. This type of breakdown typically occurs after a period of consolidation or when selling pressure exceeds the ability of buyers to defend a level.
The $0.7046 level had functioned as an anchor in the preceding rally or range-bound structure. Once breached, it typically transitions into resistance - meaning any attempt to reclaim this price would face renewed selling pressure from traders who entered long positions at or above this level and are now underwater.
Next Structural Level: $0.6710
With $0.7046 now in the rearview, the immediate focus shifts lower to $0.6710. This represents the next meaningful structural support in the downtrend. The distance between $0.6873 (current) and $0.6710 is approximately 0.24%, a relatively tight range that suggests price may test this level in the coming hours or session cycles.
Structural support levels like $0.6710 typically represent prior swing lows, Fibonacci retracements, or areas where volume clusters on the order book. If price reaches and holds this level, it signals buyers are willing to accumulate at this zone. If it breaks through decisively, the search for support extends further down the chart.
Charting the Session Momentum
The current trading session is showing clear directional bias. In the Asia or early London session, $ASTER has already accomplished the breakdown; how price acts from here - whether it stabilizes, bounces, or continues lower - will determine whether $0.6710 holds or becomes the next casualty.
On momentum indicators, watch for RSI divergence (higher lows in price but lower lows in RSI can signal potential reversal), or MACD crossover signals if a bounce does occur near $0.6710. Volume is also critical here: breakdowns on high volume are typically more durable than those on declining volume.
Key Takeaways
- $ASTER has lost the $0.7046 support level and is now testing $0.6873 on the 4H chart, a technical breakdown that shifts focus lower
- The next structural support sits at $0.6710, roughly 0.24% below current price
- Watch for either accumulation around $0.6710 or a continuation lower if this level breaks; momentum indicators and volume will provide confirmation