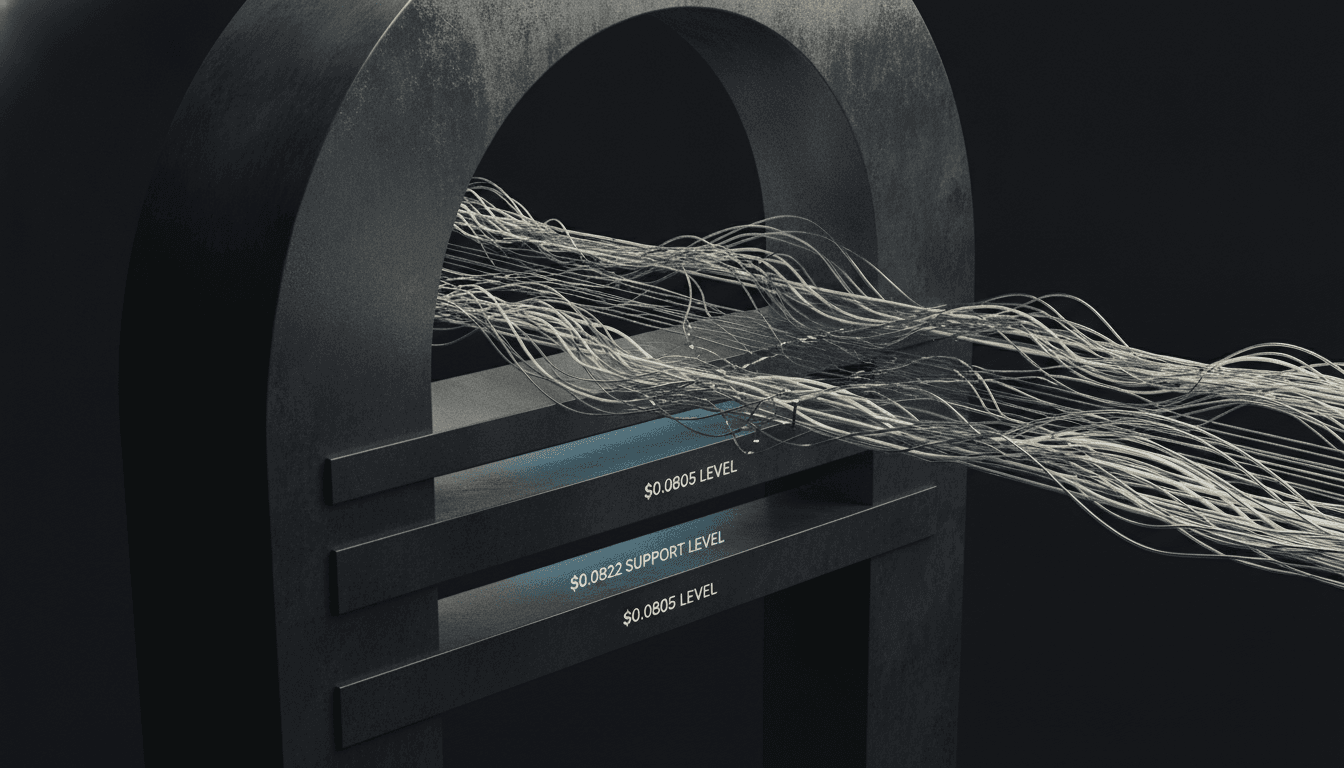
Structural Support Loss
$DOGE broke below $0.0842 on the 4-hour timeframe, a level that had functioned as a meaningful support zone. The asset is currently trading near $0.0819, confirming the breakdown and establishing a new range floor. This move occurred during Asia-session volatility, where lower liquidity can amplify directional moves.
The loss of $0.0842 is significant because it was a swing low from prior trading sessions and acted as a psychological and technical anchor. When support of this magnitude breaks, it typically triggers algorithmic selling and liquidation cascades in leveraged positions. Traders holding longs above $0.0842 faced forced exits, compounding downside momentum.
The $0.0805 Level Ahead
The next structural support sits at $0.0805, representing the next meaningful consolidation zone on the 4-hour chart. This level is not arbitrary: it corresponds to a prior swing low and aligns with horizontal price discovery points from earlier trading sessions. If $DOGE continues lower without reversal signals, $0.0805 becomes the logical target for bears.
The distance from current price ($0.0819) to this level is roughly 1.7% - a minor move that could occur within a single session. Volume profile data from recent sessions will determine whether $0.0805 holds or gives way to further downside. Traders should monitor whether this level attracts bid-side volume or if selling persists through it.
Price Action and Momentum Signals
The 24-hour decline of -4.11% for $DOGE reflects a broader multi-asset pullback, with $BTC down -2.12% and $ETH down -4.11% over the same period. This correlation suggests macro headwinds rather than asset-specific weakness. On-chain volume during the breakdown was adequate, confirming that the move was participant-driven and not a flash move.
RSI and MACD data from the 4-hour chart will indicate whether momentum is waning or accelerating downward. A clean break below $0.0805 without reversal wicks would signal institutional conviction in the downside. Conversely, a rejection at $0.0805 with a sustained bid would suggest accumulation interest and potential range-formation.
Social sentiment for $DOGE remains elevated at 79% positive according to LunarCrush metrics, which typically lags price action during sharp corrections. This disconnect between sentiment and price structure often precedes either a bounce (if sentiment eventually resets lower) or a sharp continuation (if price structure deteriorates further before sentiment catches up).
Key Takeaways
- $DOGE lost the $0.0842 support level on the 4-hour chart and now trades near $0.0819, confirming a structural breakdown.
- The next target for sellers is $0.0805, the prior swing low and logical consolidation zone.
- Volume and intraday price action at $0.0805 will determine whether this level holds or if further downside pressure materializes.
- Broader market correlation with $BTC and $ETH suggests macro factors are driving the move, not asset-specific catalysts.
- Elevated social sentiment (79% positive) has not yet reset, creating potential asymmetry between narrative and technical structure.